
Ecg Graph Monitoring With Hexabitz

Made by Aula_Jazmati / Environmental Sensing / Health / Kids & Family / Sensors / IoT
About the project
The project aims to develop a real-time ECG monitoring system that is both affordable and easy to use.
Project info
Difficulty: Moderate
Platforms: STMicroelectronics
Estimated time: 1 hour
License: MIT license (MIT)
Items used in this project
Hardware components

View all
Story
Imagine being able to monitor your ECG signs in real-time, wherever you are. Our project aims to make this a reality by developing a portable and affordable ECG monitoring system. We chose to work with Hexabitz modules due to their flexibility and modularity, which allowed us to create a system that is both customizable and easy to use.
🫀 What is ECG?An ECG is a paper or digital recording of the electrical signals in the heart. It is also called an electrocardiogram or an EKG. The ECG is used to determine heart rate, heart rhythm, and other information regarding the heart’s condition. ECGs are used to help diagnose heart arrhythmias, heart attacks, pacemaker function, and heart failure.
ECG

ECG
ECG can be analyzed by studying components of the waveform. These waveform components indicate cardiac electrical activity. The first upward of the ECG tracing is the P wave. It indicates atrial contraction.
The QRS complex begins with Q, a small downward deflection, followed by a larger upwards deflection, a peak (R); and then a downwards S wave. This QRS complex indicates ventricular depolarization and contraction.
Finally, the T wave, which is normally a smaller upwards waveform, representing ventricular re-polarization.
- History of the Electrocardiogram
The last decade of the nineteenth century saw the emergence of a new era in which physicians used new technologies alongside old biographies and physical examinations to diagnose and treat heart disease. The introduction of X-rays of the chest in 1895 and the electrocardiograph in 1902 provided objective information about the structure and function of the heart. The primary electrocardiograph used a filament galvanometer to record potential differences due to the electrical activity of the heart. In the first half of the twentieth century, some scientists and innovators continued their discoveries and inventions in the development of the electrocardiogram, which led to the introduction of the 12-lead electrocardiogram we now know.Today, electrocardiography is the most important tool for the initial assessment of the condition of heart patients and, in particular, plays an important role as a non-invasive and cost-effective tool for assessing arrhythmias and ischemic heart disease. Health care providers at various levels of education and expertise consider ECG interpretation to be essential as the first diagnostic tool. Learn more: https://en.wikipedia.org/wiki/Electrocardiography.
ECG was invented in 1895. Before 1895 ^_^

ECG was invented in 1895. Before 1895 ^_^
Old field galvanometer electrocardiography; The image of a large device shows the patient washing their limbs in electrode-filled cylindrical electrodes

Old field galvanometer electrocardiography; The image of a large device shows the patient washing their limbs in electrode-filled cylindrical electrodes
- Electrodes and leads
Proper placement of the limb electrodes. The limb electrodes can be far down on the limbs or close to the hips/shoulders as long as they are placed symmetrically.
Electrodes are the actual conductive pads attached to the body surface. Any pair of electrodes can measure the electrical potential difference between the two corresponding locations of attachment. Such a pair forms a lead. However, "leads" can also be formed between a physical electrode and a virtual electrode, known as Wilson's central terminal (WCT), whose potential is defined as the average potential measured by three limb electrodes that are attached to the right arm, the left arm, and the left foot, respectively.
Two types of electrodes in common use are a flat paper-thin sticker and a self-adhesive circular pad. The former are typically used in a single ECG recording while the latter are for continuous recordings as they stick longer. Each electrode consists of an electrically conductive electrolyte gel and a silver/silver chloride conductor. The gel typically contains potassium chloride – sometimes silver chloride as well – to permit electron conduction from the skin to the wire and to the electrocardiogram.
An ECG Electrode

An ECG Electrode
The common virtual electrode, known as Wilson's central terminal (VW), is produced by averaging the measurements from the electrodes RA, LA, and LL to give an average potential of the body:

Einthoven's triangle is an imaginary formation of three limb leads in a triangle used in the electrocardiography.
Graphical representation of Einthoven's triangle

Graphical representation of Einthoven's triangle
🛠️ Tools:Tools

Tools
🌟 Single-Lead, EXG Monitor (H2BR0x):
Hexabitz Single-Lead, EXG Monitor Module (H2BR0) is one of a kind module that can record publication-grade biopotential signals from your body be it from the heart (ECG), brain (EEG), eyes (EOG), and muscles (EMG).
What makes it different?
- Record publication-quality biopotential signals like ECG, EMG, EOG, or EEG.
- Small size allows easy integration into mobile and space-constrained projects.
- Notch filter (second order) to remove 50 Hz AC mains.
- H2BR0 is based on STM32G0 MCU.
- Program advanced C code with our easy-to-use APIs.
- You can connect to external hardware or combine with other Hexabitz modules!
- The module is equipped with an open source MATLAB interface.
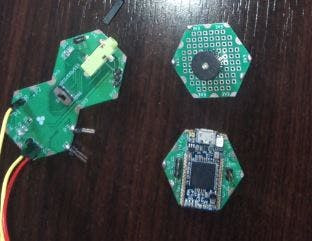
1 / 2 • Single-Lead, EXG Monitor (H2BR0x) Module

Single-Lead, EXG Monitor (H2BR0x) Module

Hexabitz Single-Lead, EXG Monitor Module (H2BR0)
H2BR0x Output Signals
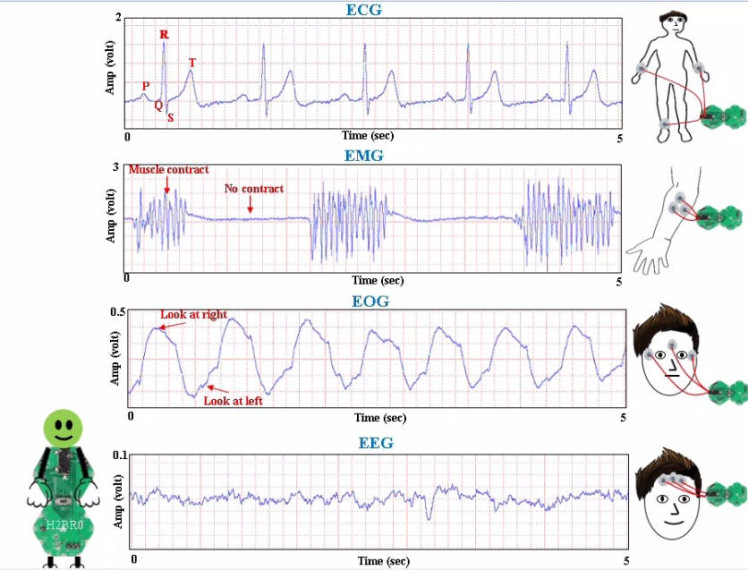
H2BR0x Output Signals
🩺 Sensor Cable – Electrode Pads (3 Connector):
This is a simple three conductor sensor cable with electrode pad leads. The cable is 24˝ long and feature a 3.5mm audio jack connector on one end with snap style receptacles for biomedical sensor pads.
1 / 2 • Sensor Cable

Sensor Cable

ECG Leads Placements

ECG Leads Placements
🌟 STLINK-V3MODS Programmer (H40Rx):
H40Rx is a programmer module which contains STLINK-V3MODS stand-alone debugging and programming mini probe for STM32 micro-controllers (Hexabitz modules and other MCUs).
It supports the SWD (Serial Wire Debugging) interface for the communication with any STM32 micro-controller located on an application board.
It also provides bridge interfaces to several communication protocols, allowing for instance the programming of the target through boot-loader.

Step 1 🖤 Writing codes with STM32CubeIDE software:
- Check out this article for writing code with STM32CubeIDE.
- Check out this article for Utilize Modules Ports as Independent Controller Ports Outside of BOS System.
- Add the instructions for configuring the pin you are going to use in gpio.c file.
GPIO_InitStruct.Pin = GPIO_PIN_3;
   GPIO_InitStruct.Mode = GPIO_MODE_OUTPUT_PP;
   GPIO_InitStruct.Pull = GPIO_NOPULL;
   GPIO_InitStruct.Speed = GPIO_SPEED_FREQ_LOW;
HAL_GPIO_Init(GPIOD, &GPIO_InitStruct);- In the repeated closed loop, we made sure that MCU periodically checks the
ECGsample value andECGfiltered sample value of the sensor using the API.
Get_ECG_Sample(&EXGStruct, &sample, &filteredSample );- If the
ECGsample value achieves the required condition, the buzzer is turned on at certain time.
if(sample > 2.2) {
 HAL_GPIO_WritePin(GPIOD,GPIO_PIN_3, 1); //p5 - Top
 HAL_Delay(50);
HAL_GPIO_WritePin(GPIOD,GPIO_PIN_3, 0); }- This value was first monitored using the STM32CubeIDE debugging function to monitor sample value live expressions, as shown in the screenshot:
STM32CubeIDE Debugging Function

STM32CubeIDE Debugging Function
Step 2 🖤 Set up the Monitor 📉
- Check out these articles for Build GUI using STM32CubeMonitor.
1 / 3 • STM32CubeMonitor Flow

STM32CubeMonitor Flow

STM32CubeMonitor Chart Node

STM32CubeMonitor Variables Node
ECG Dashboard

ECG Dashboard
Step 3 🖤 Hardware setup:
- Connect the buzzer to p5 and GND.
- You can also solder the buzzer at the Proto module.

1 / 3


- You need to connect ST-Link (H40Rx Module) to ExG module by SWD (Serial Wire Debugger), and power the module in 3.3V. Learn more Here.
Block Diagram

Block Diagram
💙 Test the System 🔍The images below show electrode placements for leads:
ECG (aVR) Electrode Placements

ECG (aVR) Electrode Placements
ECG (II) Electrode Placements

ECG (II) Electrode Placements
Examples of graph 📈🫀🔍
1 / 3 • ECG (Type II) Dashboard Test

ECG (Type II) Dashboard Test

ECG (Type II) Dashboard Test

ECG (Type II) Dashboard Test
1 / 2 • ECG (aVF) Dashboard Test

ECG (aVF) Dashboard Test
ECG (Type aVR) GUI Test
1 / 3 • ECG (aVR) Dashboard Test

ECG (aVR) Dashboard Test

ECG Dashboard Test

ECG Dashboard Test
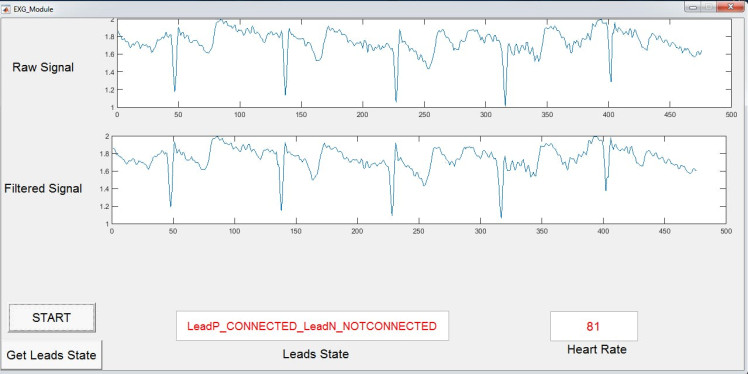
1 / 4 • Hexabitz ECG MATLAB GUI Test

Hexabitz ECG MATLAB GUI Test

Get Leads State

Get Leads State

Get Leads State
ECG (II) Dashboard Video
Please feel free to leave a comment here if you have any questions or concerns regarding this project 😃

Schematics, diagrams and documents
CAD, enclosures and custom parts
Code
Credits
Related products


Leave your feedback...